
Infordata completed the structure of the Inspire Impact Dashboard for both private and public areas of the web tool.
Private workspace (researchers): secure access for uploading datasets, running analyses, and viewing detailed telemetry and models.
Public workspace (stakeholders): open views that showcase project progress, with summary statistics, interactive charts, and maps for broader communication and engagement. What’s new (latest releases):
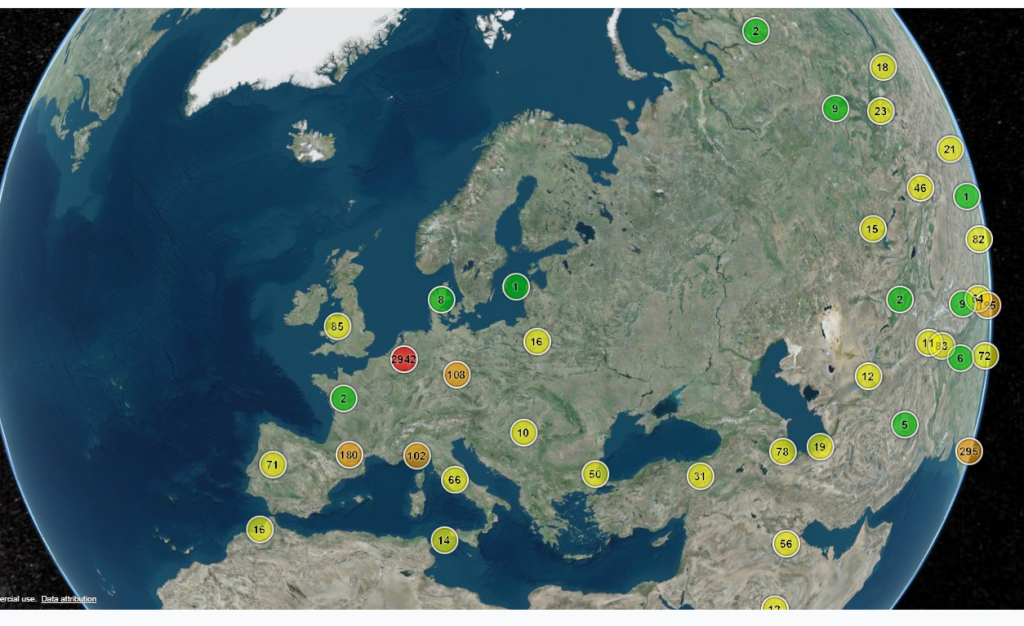
- 3D globe with Riverline integration: explore a 3D interactive map linked to the Riverline database, now exposing ~24,000 georeferenced records with drill-downs to key attributes.
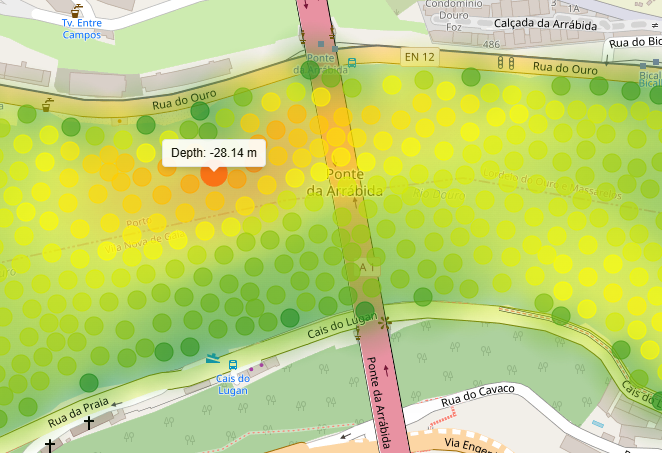
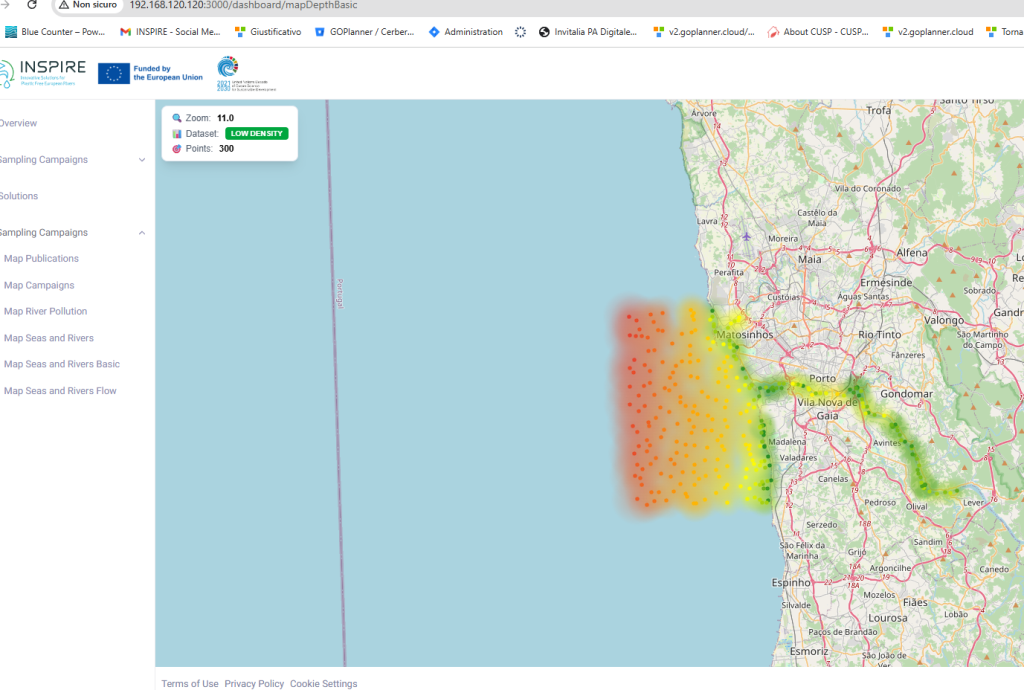
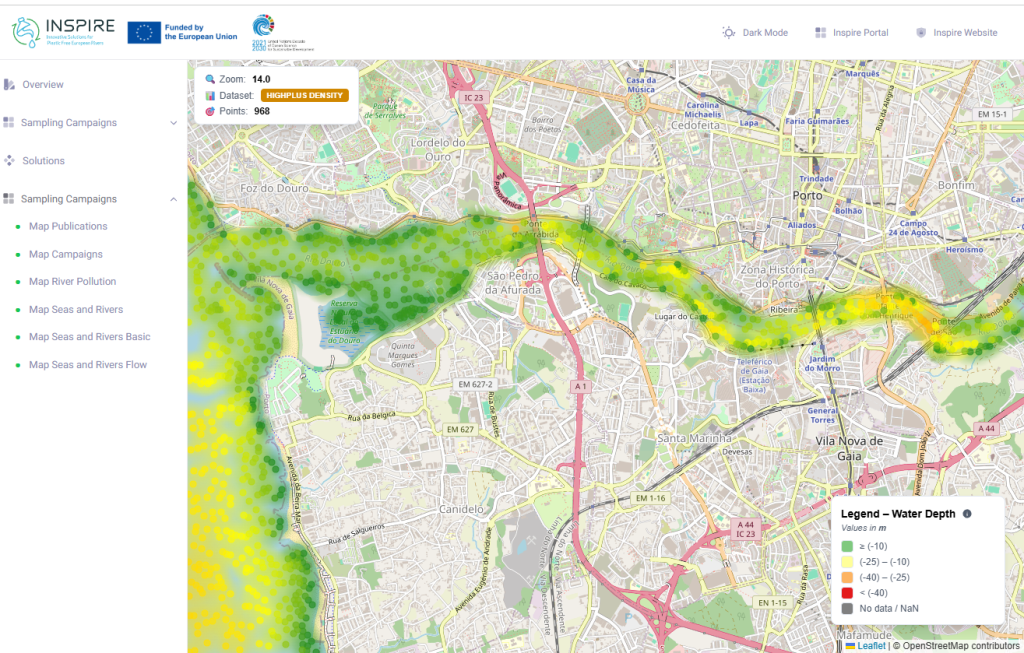
- Hydrodynamic & transport views: animated model visualizations (e.g., Douro River) show flow dynamics and microplastic transport pathways to support hypothesis testing and scenario analysis.
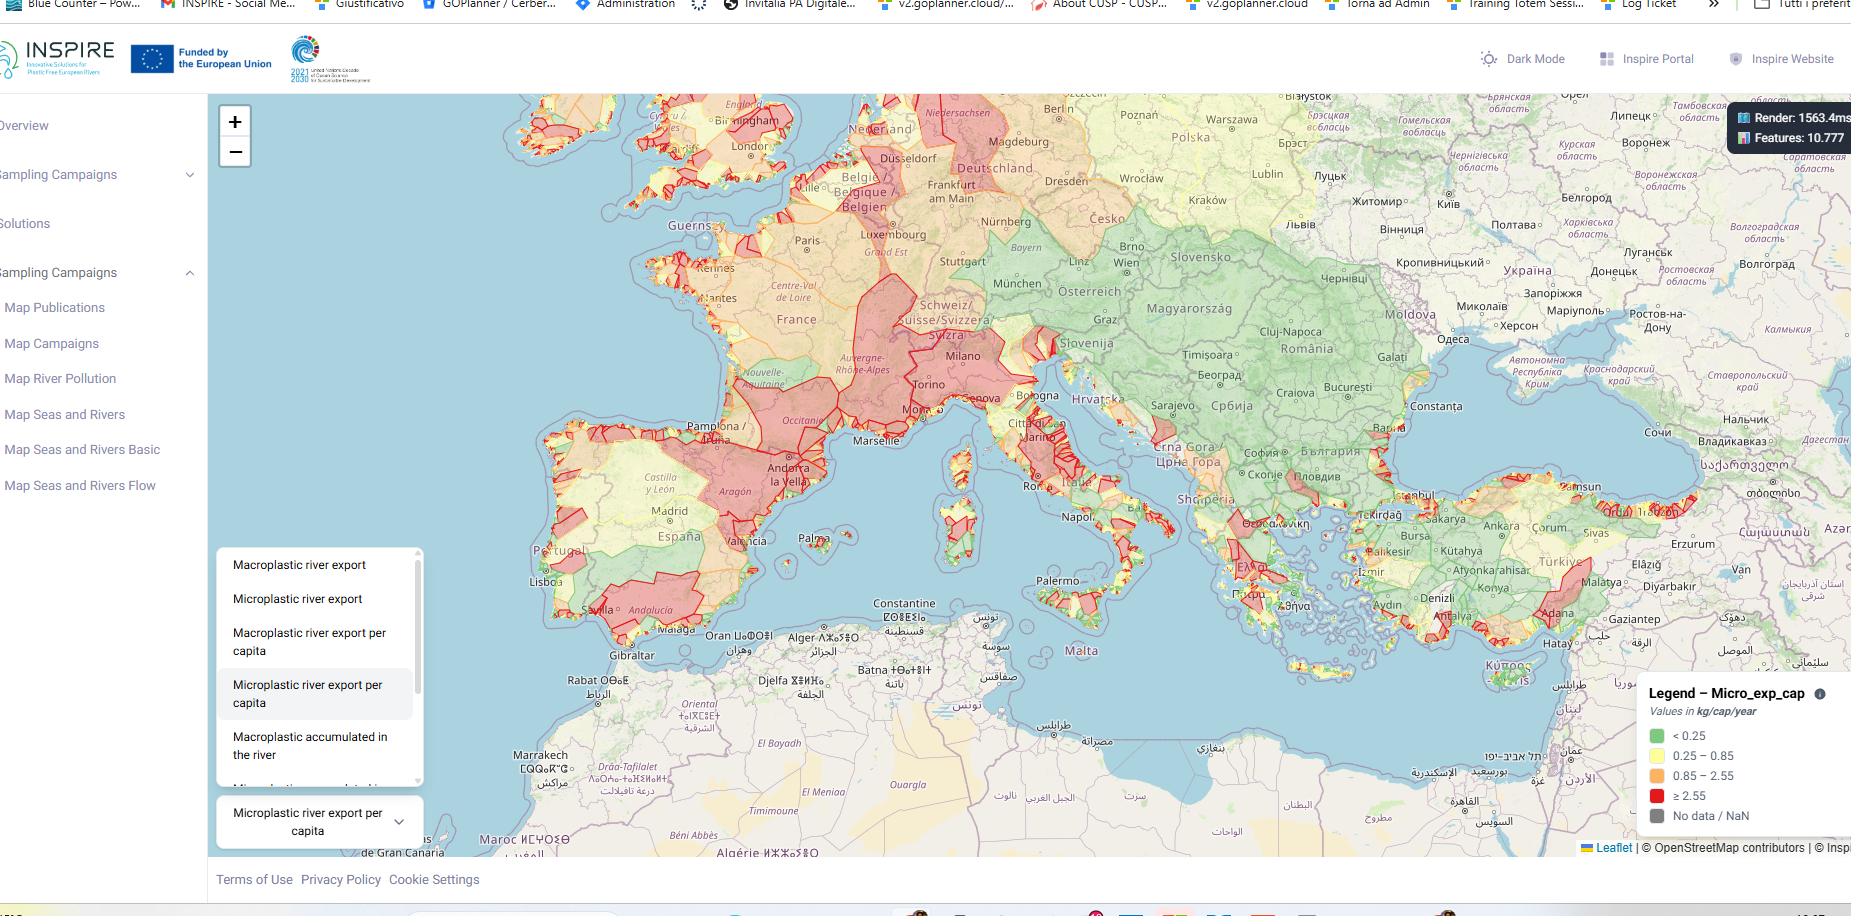
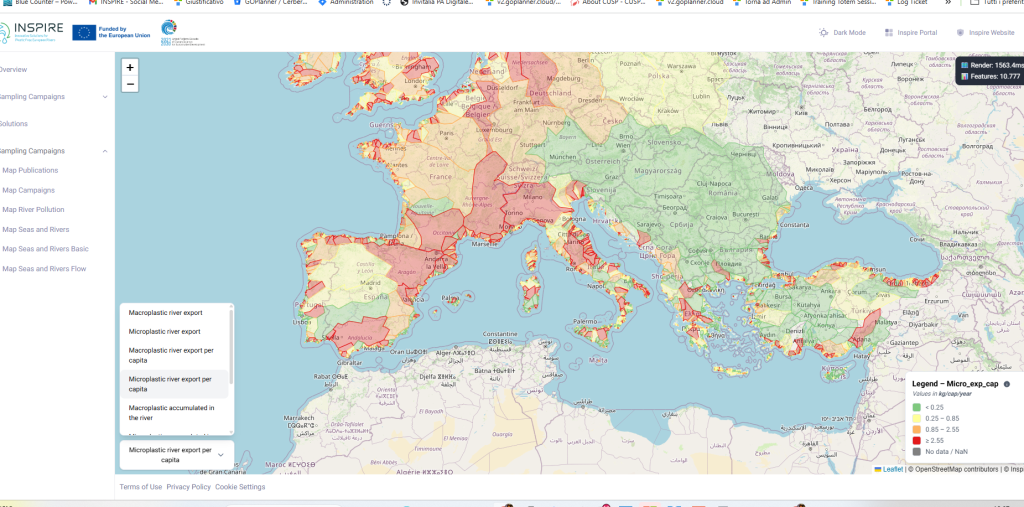
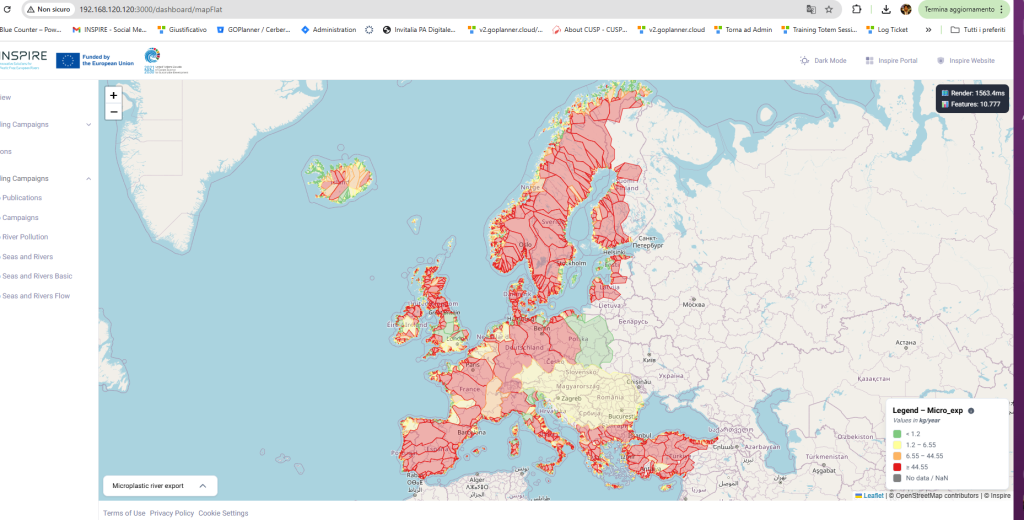
- European river pollution insights: a dedicated section aggregates modeled indicators for river pollution across Europe, with partner-provided datasets to compare pollution levels, statistics, and microplastic accumulation.
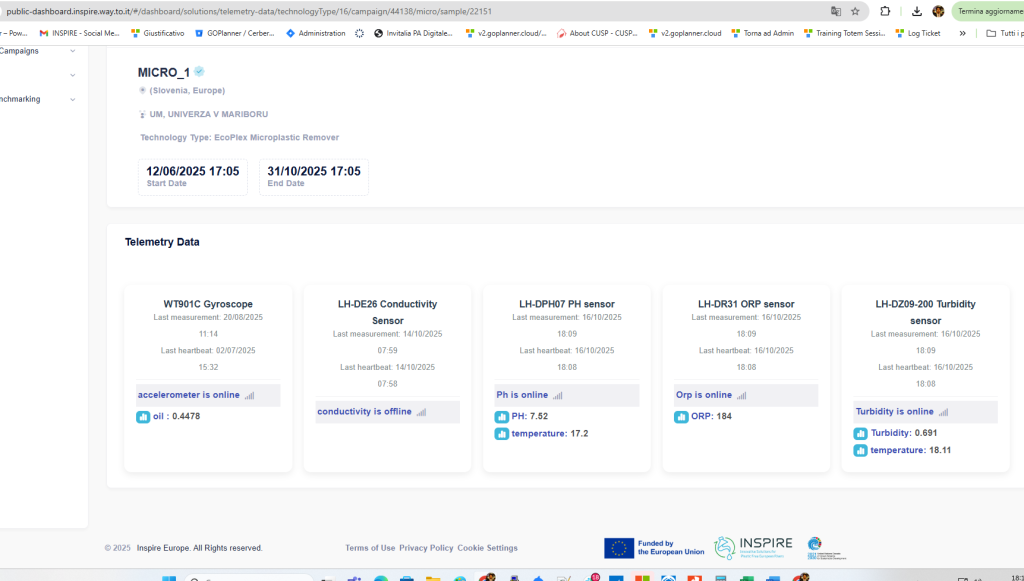
- AI-enabled sensing: first production connection of our AI-assisted sensor stack captures vibration, flow/throughput, and water-quality metrics upstream and downstream of technologies—supporting performance diagnostics and yield estimation.
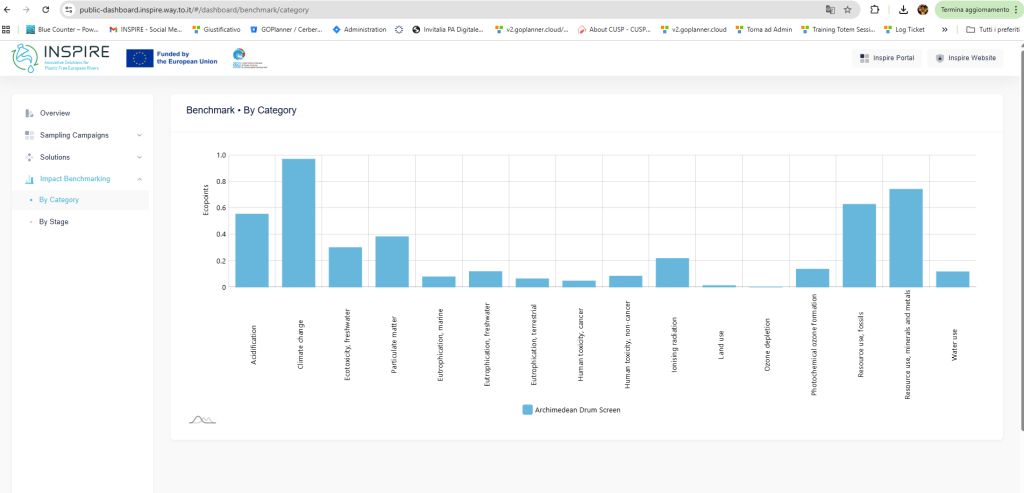
- LCA roll-out: initial Life Cycle Assessment (LCA) results for selected technologies are now published in the dashboard; additional technologies will follow as verification is completed.
At a glance (benefits)
- One place for multi-source ML data, harmonized and FAIR.
- Real-time operational visibility from field technologies.
- Comparable KPIs for benchmarking detection and collection solutions.
- Advanced visualization (3D globe, animated transport) for rapid insight.
- Standards-compliant formats and APIs for easy integration.